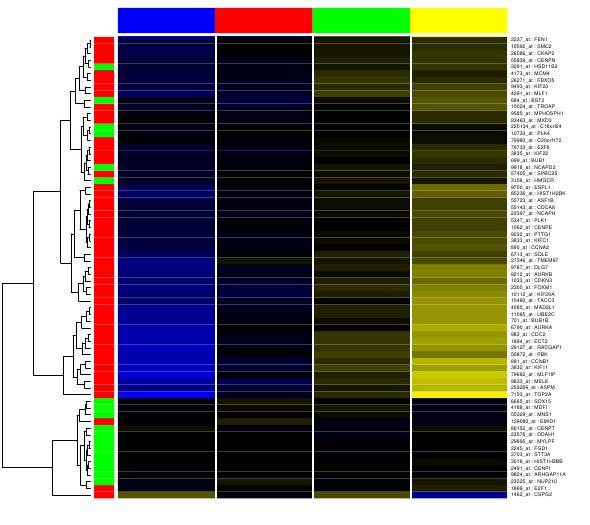
Click on the ``statistical Analysis'' link and you will get a
heatmap as shown in ![[*]](crossref.png) . The
corresponding legends can be found by clicking on the link ``legend
for all the heatmaps'' as shown in .
One can see that indeed the genes in the query list are up-regulated
in large tumors (quart-4) and are enriched for differentially expressed
gene (LRpath p-value<10-9).
. The
corresponding legends can be found by clicking on the link ``legend
for all the heatmaps'' as shown in .
One can see that indeed the genes in the query list are up-regulated
in large tumors (quart-4) and are enriched for differentially expressed
gene (LRpath p-value<10-9).
Similar analysis could be performed on the other 3 datasets using the same list of 85 up regulated proliferation genes. We have established the universality of the proliferation signature identified in the rat dietary studies across four very different biological systems using the Genomics Portals interface. The entire process of querying and generating results can be completed in less than 10 minutes. More details could be obtained from the manuscript.