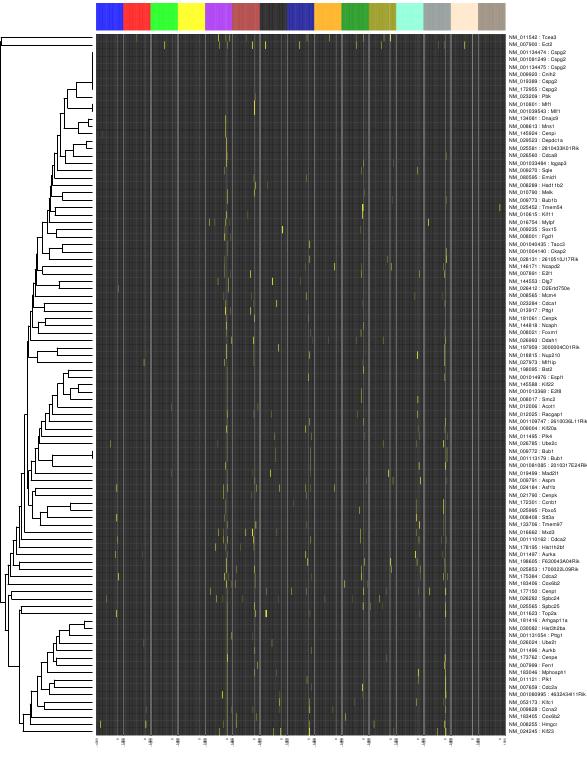
Click on the link ``Centered data'' under static heatmap column
of the result table. Figure ![[*]](crossref.png) shows heatmap
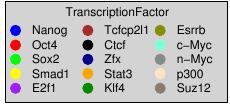
of 15 Tfs and figure displays corresponding
legends for each of the TFs.
shows heatmap
of 15 Tfs and figure displays corresponding
legends for each of the TFs.
We can see that in addition to most of the genes having a ChIP-seq peak for E2F1 within the regulatory region examined (-4kb to +1kb around TSS marked by 0), there were several other transcription factors such as N-myc,Tcfp2l1,c-Myc etc. that seem to have unusually many peaks for these gene. We can then focus on each of the TFs separately to take a closer look. We will illustrate the case using n-Myc TF.
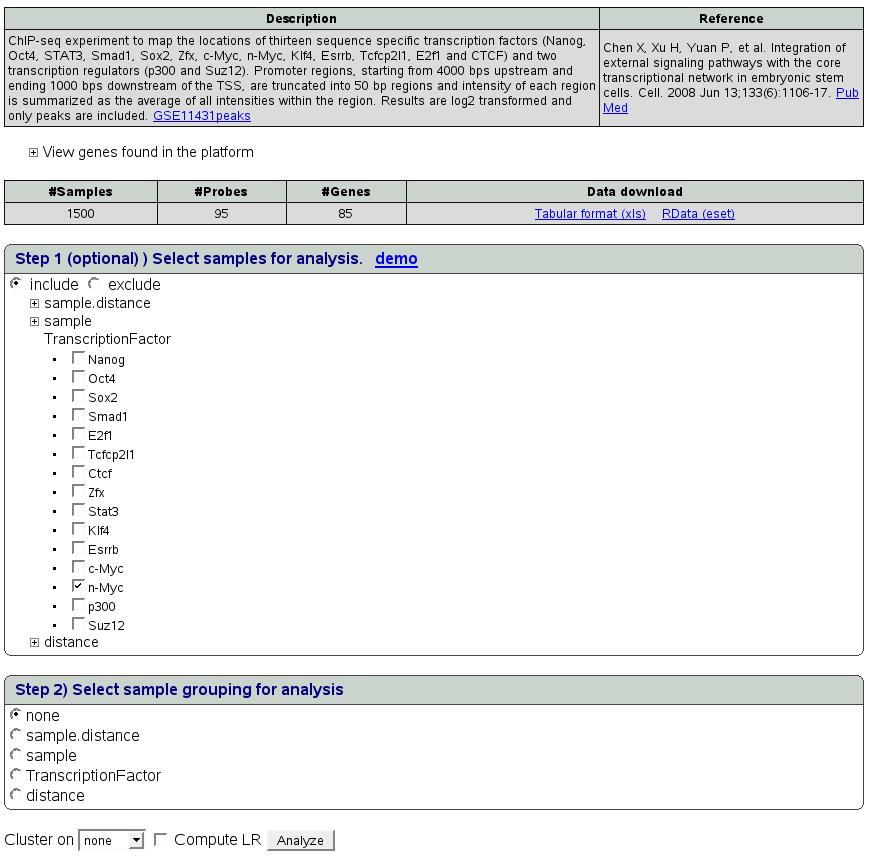
We can select n-Myc TF out of 15 Tfs using ``select sample'' option
in step 1 as shown in figure . Expand ``Transcription
Factor'' and select n-Myc TF and click radio button ``include''
to select this sample. Then select ``TranscriptionFactor'' in
step 2. select Cluster on ``Genes'' and ``compute LR'' options
and click ``Analyze''.
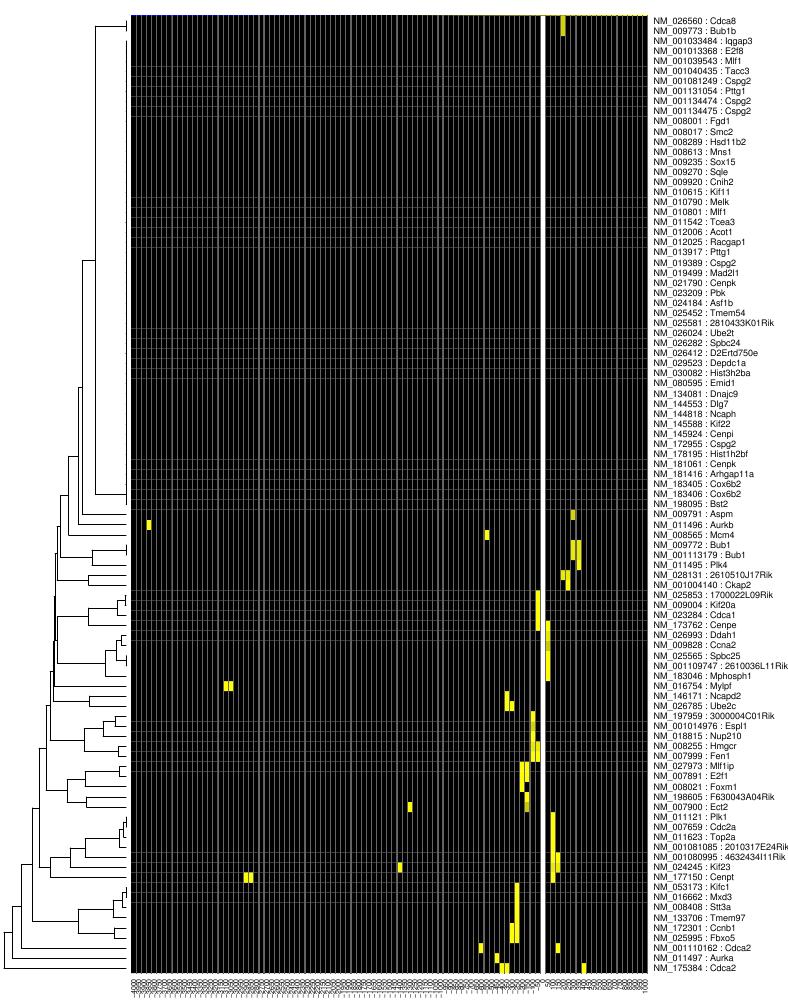
Then click on the link ``Centered data'' under static heatmap
column of the result table. Figure shows
increased binding around TSS of the promoter region (-4kb to +1kb
in this case) for some of these genes.
Here, we used the comparison to ``random'' sample by LRpath. Instead of the p-values, in this situation Genomics Portals by default uses the maximum ``peak intensity'' calculated for each gene across its whole regulatory region. Such statistical analysis confirmed that in addition to E2F1 (p-value < 10-14), n-Myc (p-value < 10-7), Tcfp2l1 (p-value < .001), c-Myc (p-value < .01), and Klf4 (p-value < 0.01) all show signs of increased binding to regulatory regions of these genes.