|
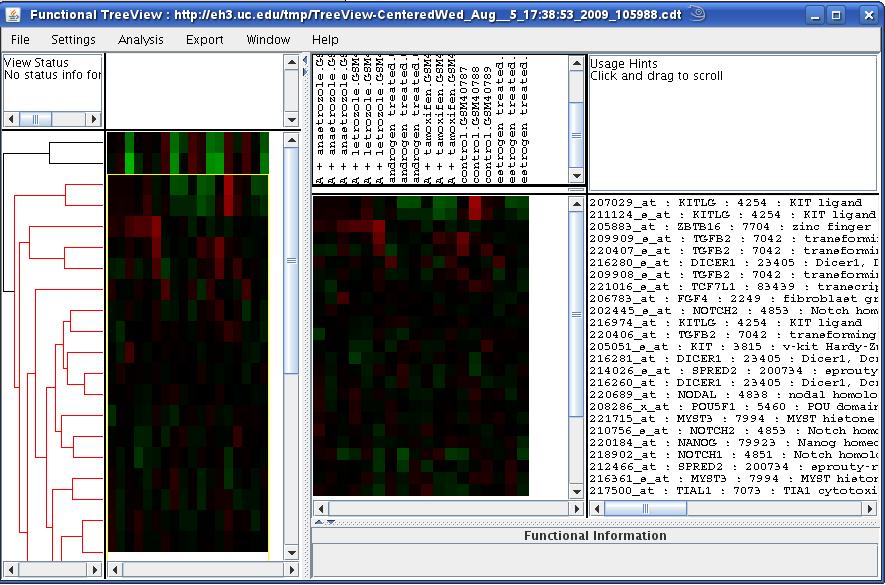
Unsupervised clustering of the query data was performed using the Bayesian model-based procedures [1] as well as simple hierarchical clustering. The functional annotation of the clustering structures was performed using the CLEAN framework [2], the integrative browsing of the data and functional annotations is facilitated through the Functional TreeView (FTreeView) which is a Java web-start based clustering browser [2]. Using FTreeView, one can identify clusters of genes based on their data profile and correlation with specific functional categories and use such gene lists to query and analyzed genomics data in other datasets.
We would like to note that in the case where no clustering option
(on the genes as well as samples) is chosen, the TreeView application
would show the heatmap with no dendrograms on either sides. This might
make the heatmap incomprehensible at first. However, one can click
on any of the genes or group of genes and the corresponding gene annotations
will be displayed in the rightmost window. The scenario is depicted
in ![[*]](crossref.png) where genes and samples
are not clustered.
where genes and samples
are not clustered.