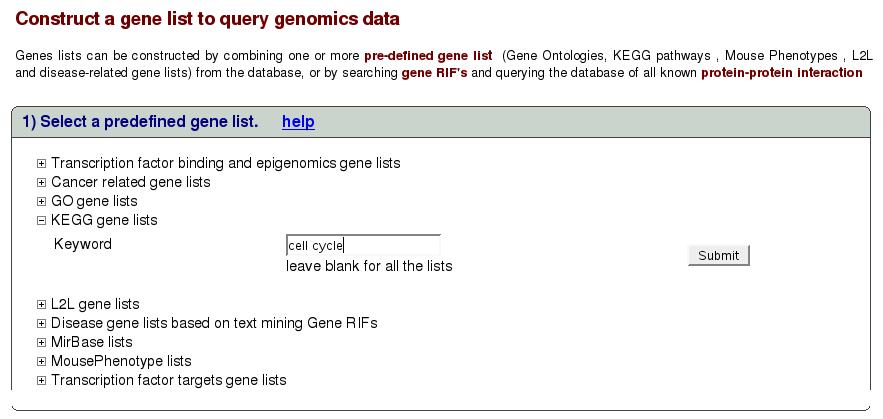
Figure![[*]](crossref.png) shows the interface to select
a predefined gene list. Clicking on ``Gene List'' tab in the left
menu would get this page. The lists are organized in different categories
and we are constantly adding new lists and categories. Let's say we
are interested in gene lists in category ``KEGG'' with keywords
``cell cycle''. Click on the link ``KEGG gene list'' to expand
the search box as shown below. Type cell cycle in the text box and
click submit.
shows the interface to select
a predefined gene list. Clicking on ``Gene List'' tab in the left
menu would get this page. The lists are organized in different categories
and we are constantly adding new lists and categories. Let's say we
are interested in gene lists in category ``KEGG'' with keywords
``cell cycle''. Click on the link ``KEGG gene list'' to expand
the search box as shown below. Type cell cycle in the text box and
click submit.
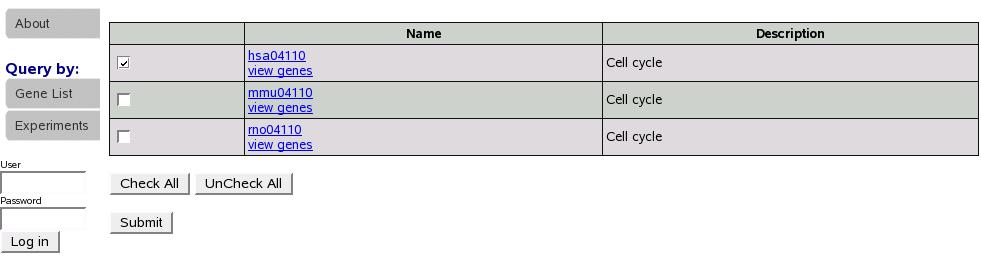
This takes us to the following screen (figure).
Here we see a list of gene list returned for the keywords. Select
one or multiple lists using the check boxes and click submit.
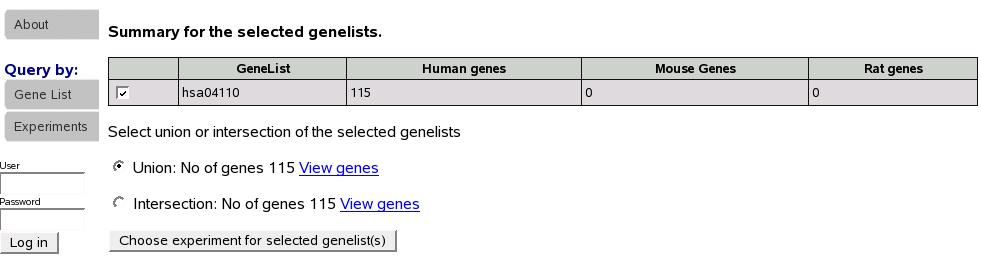
Now we see summary for the submitted lists. Note that below the summary table, we are asked to select union or intersection of the gene lists selected. In this case, because we submitted only one gene list, both union and intersection are identical. Let's select union and proceed to select an experiment for analysis.
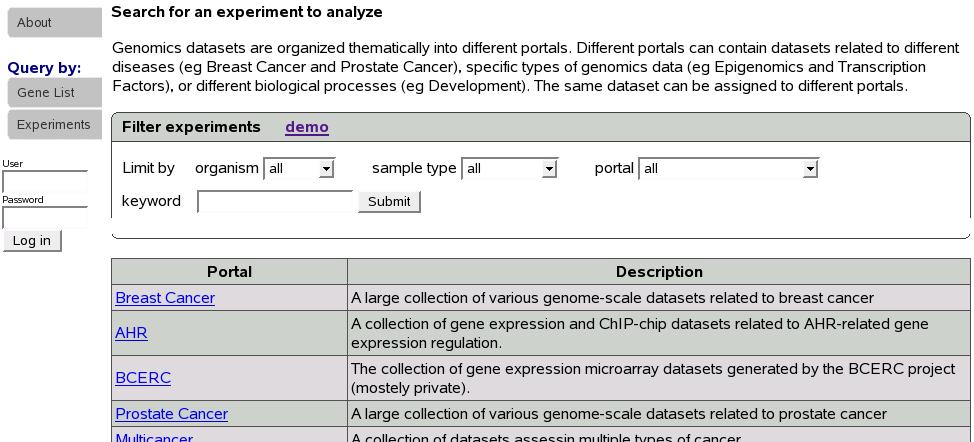
Experiments are organized into different portals. If we know the portal the experiment of our interest belongs to, we can click on the portal name to list all the experiments in that portal. Since this is not the case most times, a search function is provided to look for experiments of our interest. In the ``Filter experiments'' box shown below, select organism, sample type, portal of your interest and type in keyword. Keyword could be left blank.
Let's click on portal name ``Breastcancer'' to proceed with our example.
Figure is a part of the screen showing
experiments in the portal Breastcancer. If we had used the search
function to look for an experiment instead, a similar screen would
be shown. Below you would see a list of experiments. Let's select
first experiment (GSE10797) and scroll down and click submit.
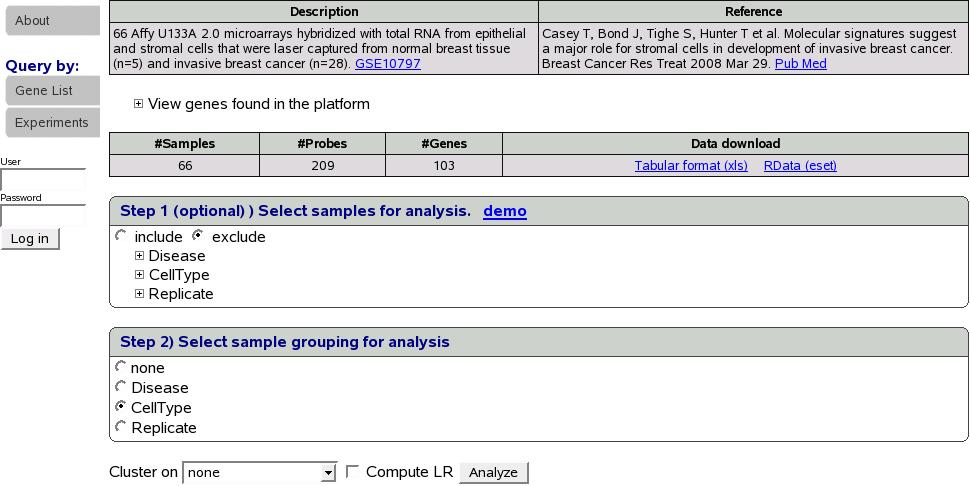
At this point, data is retrieved from database for the selected experiment
and gene list(s) as shown in figure.
One could download the data for his/her own analysis either as a tab delimited file or an eset for analysis in R. In this example, we have 66 samples, 209 probes and 103 genes. If we want to analyze only a subset of samples, we could select samples using the ''Step 1'' shown above. This step is optional and default is to select all the samples. Next we select a sample grouping for the analysis. We could choose to cluster on genes, samples, both genes and samples or none using the combo box shown above. Check the box ``Compute LR'' to compute predictive ability pvalue. Let's select ``CellType'' sample grouping, leave step 1 as it is to select all the samples, cluster on ``none'' and click Analyze button.
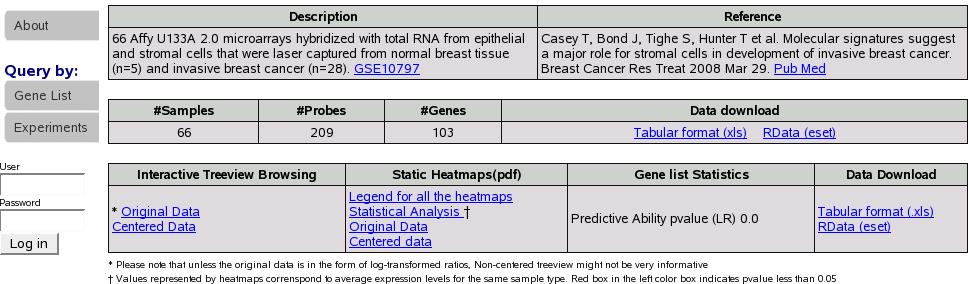
If we had checked the compute LR box we would see an additional column
``Gene list Statistics'' with the computed pvalue in the results
tables as shown in figure.
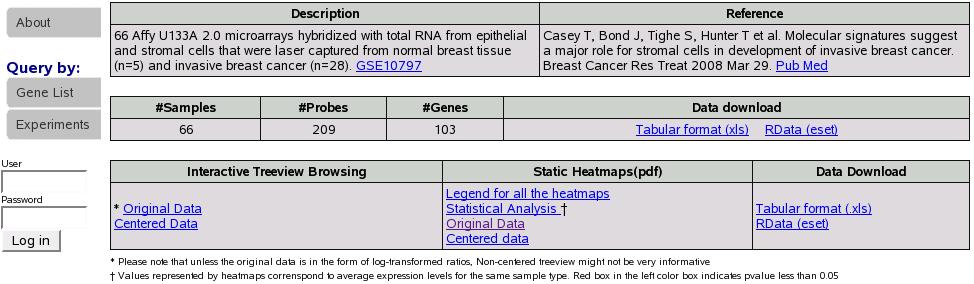
Figure depicts a typical summary table details
of which can be found in Section Interpreting Results'.